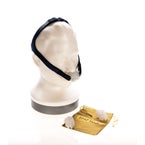
- CPAP Masks
- CPAP Machines
- CPAP Supplies
- CPAP Accessories Home Sleep Test
- Blog
Chat with a 5-star expert now!
Chat with a 5-star expert now!
- Home /
- CPAP Accessories /
- CPAP Pillows /
- Zeo
Sorry, this item is no longer available.
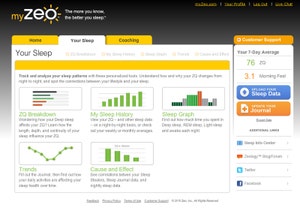
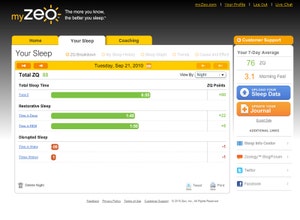
Get Your Sleep Back
Setup is easy & takes minutes
Orders ship within hours (M-F)
Resupply items set to autopilot
Item # ZEOSMBD
Not currently in stock

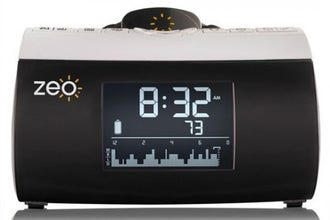
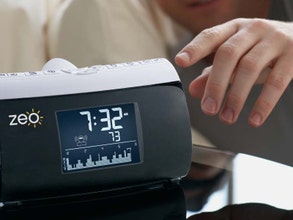

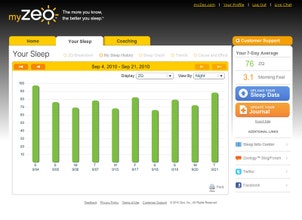
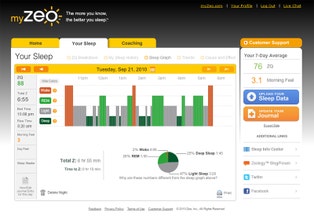
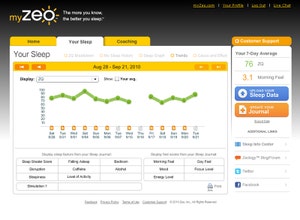
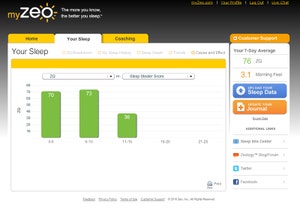
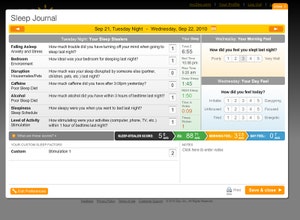
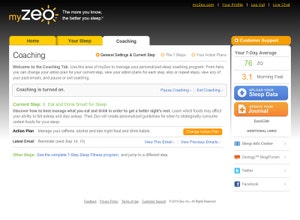


Zeo Sleep Manager - Bedside Sleep Manage
Zeo Sleep Manager - Bedside Sleep Manage
Learn More About This Product
30 Day Satisfaction Guarantee
If not completely satisfied with the product, the manufacturer offers a 30 day money back guarantee. Simply contact CPAP.com for Return Authorization and instructions within the first 30 days of purchase.
Warranty
The Zeo comes with a One Year Warranty. Please contact a CSR at CPAP.com for a Return Authorization.
Power Outlet Usage
The Zeo can be used with either a 110 volt or 220 volt outlet. An additional power adapter plug may be needed if traveling outside of the United States.
CPAP.com 100% Price Protection Guarantee
When you shop with us, we want you to be confident that you are receiving the best available price. If this items goes on sale or you spot an online or retail competitor with a lower price within seven days of your purchase, let us know, and we will credit you the difference.
"Super helpful, fast shipping, friendly assistance, great selection, I love this company."
- Verified Customer, 10/25/22
(5)
Read Reviews
Need a personal touch?
Chat with CPAP
Questions about a product or an existing order? Start a chat and let us help you out.
Start a chat

Customer Reviews
See what other customers are saying.
Nice for a while-just a while
So Far, Great
Accuracy Doubts
A Great Tool
Customers Also Viewed
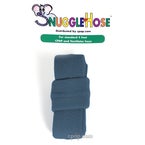
SnuggleHose Cover Blue (For 8 Foot Hose)
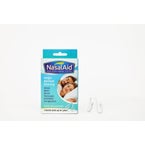
Nasal Aid | Reusable

Smart Nora: Anti-Snoring Pillow Device
myTAP Oral Appliance for Sleep Apnea
BodiMetrics CIRCUL Sleep & Fitness Ring Tracker
Pillowcase for SleePAP CPAP Pillow
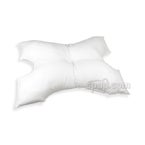
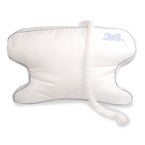
EnduriMed CPAP Pillow
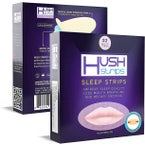
Hush Sleep Strips
Optipillow Nasal Pillow EPAP Mask for Snoring
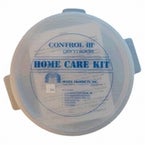
Control III Disinfectant CPAP Cleaning Solution - Home Care Kit
Breathe-free Hypoallergenic CPAP Pillow with Pillowcase
H2Doze Premium Distilled Water for CPAP Humidifiers - 16.9 oz Travel Bottle
Contour CPAPMax Pillow 2.0 with Pillow Cover